For 2026, a GS-13, step 5 in the Washington-Baltimore locality got a raise of 1.0%.
Over the 12 months to Q4 2025, the median wage-cost series in the BLS Employment Cost Index (ECI) rose 3.41%.
That gap matters more than most small contractors think. Federal pay is moving at 1%. The people you need to hire and keep are working in a market moving at more than three times that pace. Your option-year escalation factor sits between those two numbers, and if you set it from the wrong one, you're locking in a margin problem for the next four or five years.
It's late April, so a lot of you are setting escalation assumptions for proposals and option-year pricing right now. Here's what the public wage data says.
💡 From the GovIntel desk this week
- $14.8 billion in DHS obligations for Oct 2025 to Jan 29, 2026, up from $5.4 billion a year earlier. DoD award data lags about 90 days.
- $121.0 billion in DoD obligations through Jan 29, 2026, down from $127.4 billion a year earlier. Defense is still the largest buyer, but this period is smaller.
- $6.1 billion went through total small business set-asides across 60,009 actions in FY2026 to Jan 29, 2026. That is the main pool reserved for small firms.
- 2,487 new total small business set-aside notices (solicitations, presolicitations, sources sought) hit SAM.gov in the week to Apr 29, close to the 2,510 with no set-aside.
- 138 DoD justification notices cited FAR 6.302-1 (only one source able to meet the need) in the 30 days to Apr 29, totaling about $815 million.
- 2 outright GAO protest sustains in the 90 days to Apr 29, among 73 decisions (51 of them denied), versus 4 sustains in the prior 90 days.
Data as of April 29, 2026, from IPS GovIntel: federal awards, opportunities, protests, rules and budgets, updated daily.
Wage growth cooled. It didn't stop.
We track the ECI in GovIntel, our federal contracting data warehouse, across roughly 410 series: industries, occupations, wages versus total compensation, private versus civilian. The window here is Q1 2022 through Q4 2025. Median 12-month change across those series, Q4 to Q4:
- Q4 2022: 5.02%
- Q4 2023: 4.19%
- Q4 2024: 3.79%
- Q4 2025: 3.41%
The peak in the window was Q2 2022 at a 5.26% median. Since then it has come down almost every quarter. The average across all 411 series in Q4 2025 was 3.39%, so the median isn't hiding a skewed distribution.
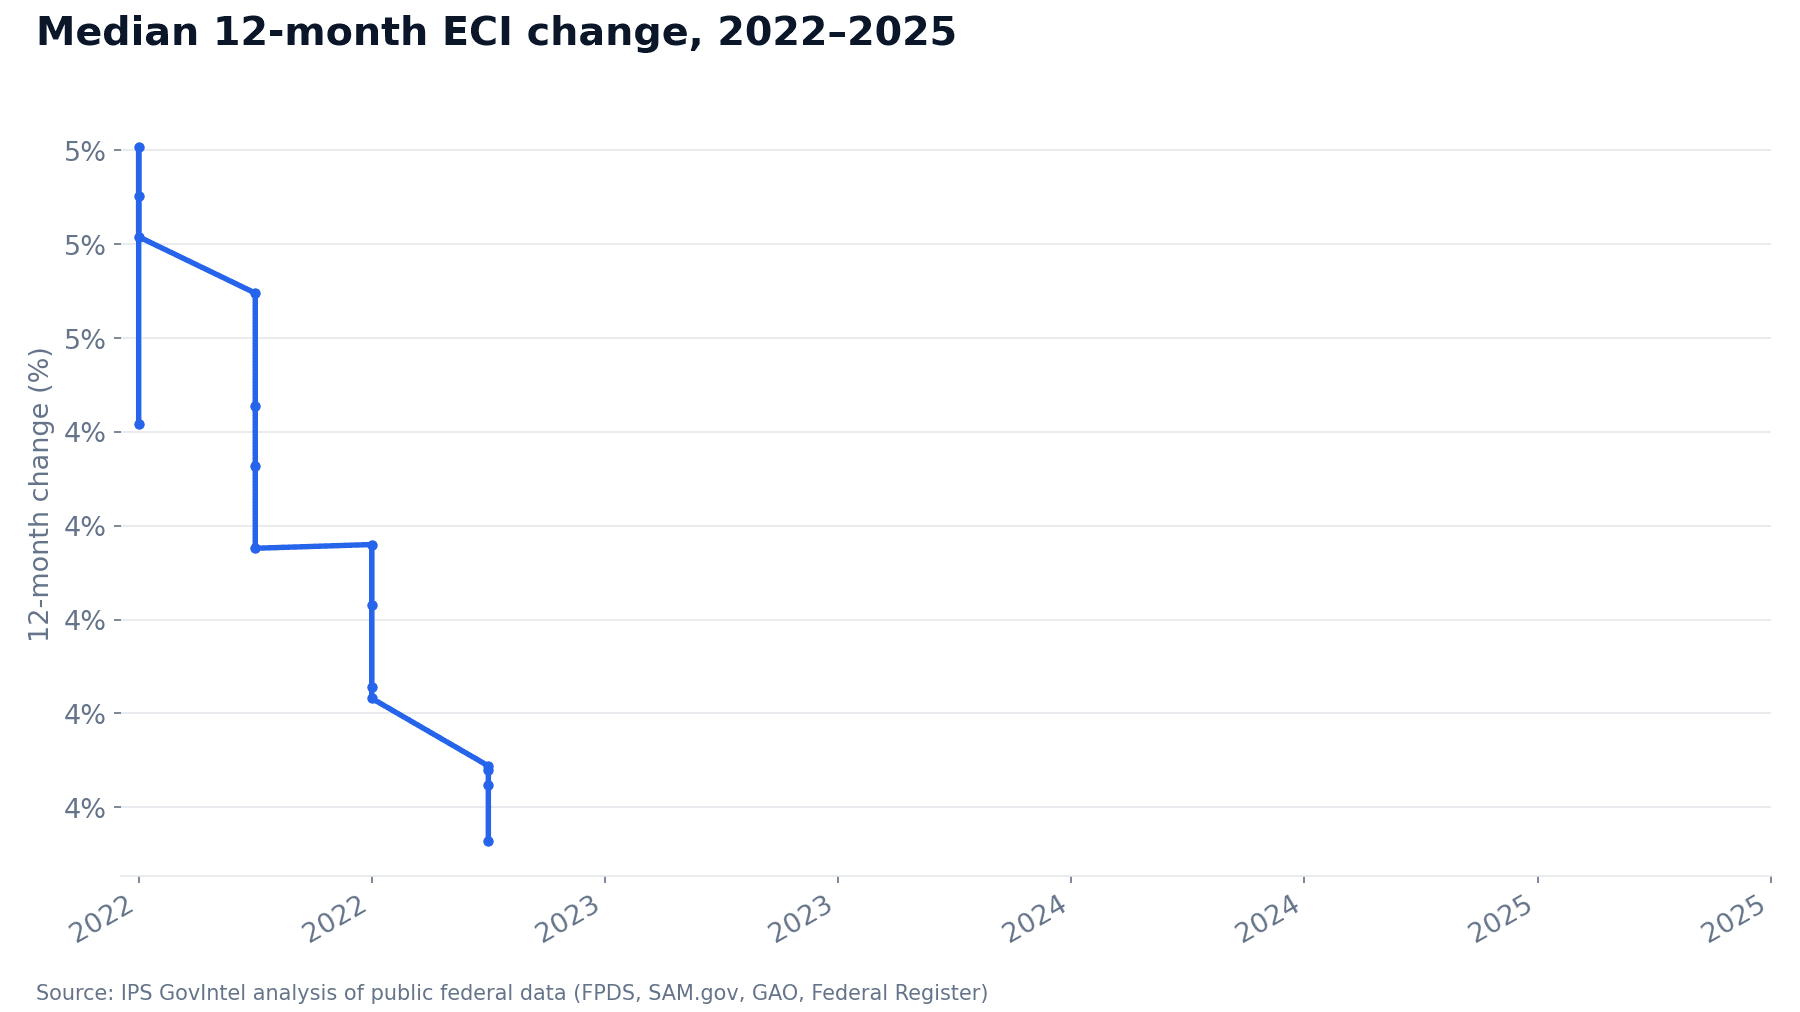
The trend is in your favor. Escalation pressure is lower than it was three years ago. But "lower" means roughly 3.4%, not 2%. If your pricing model still carries a 2% factor from whenever someone first built the spreadsheet, the median never supported it in any quarter in this window.
Where it's running hotter
The median is a blend. Some series that matter to federal contractors run well above it. The top of the Q4 2025 list:
- Manufacturing, private-industry wages and salaries: 4.6%
- Goods-producing industries: 4.53%
- Construction: 4.34%
- All industries, private-industry wages and salaries: 4.34%
- Educational services, total compensation: 4.3%
- Health care and social assistance wages: 4.2%
- Aircraft manufacturing wages: 4.17%
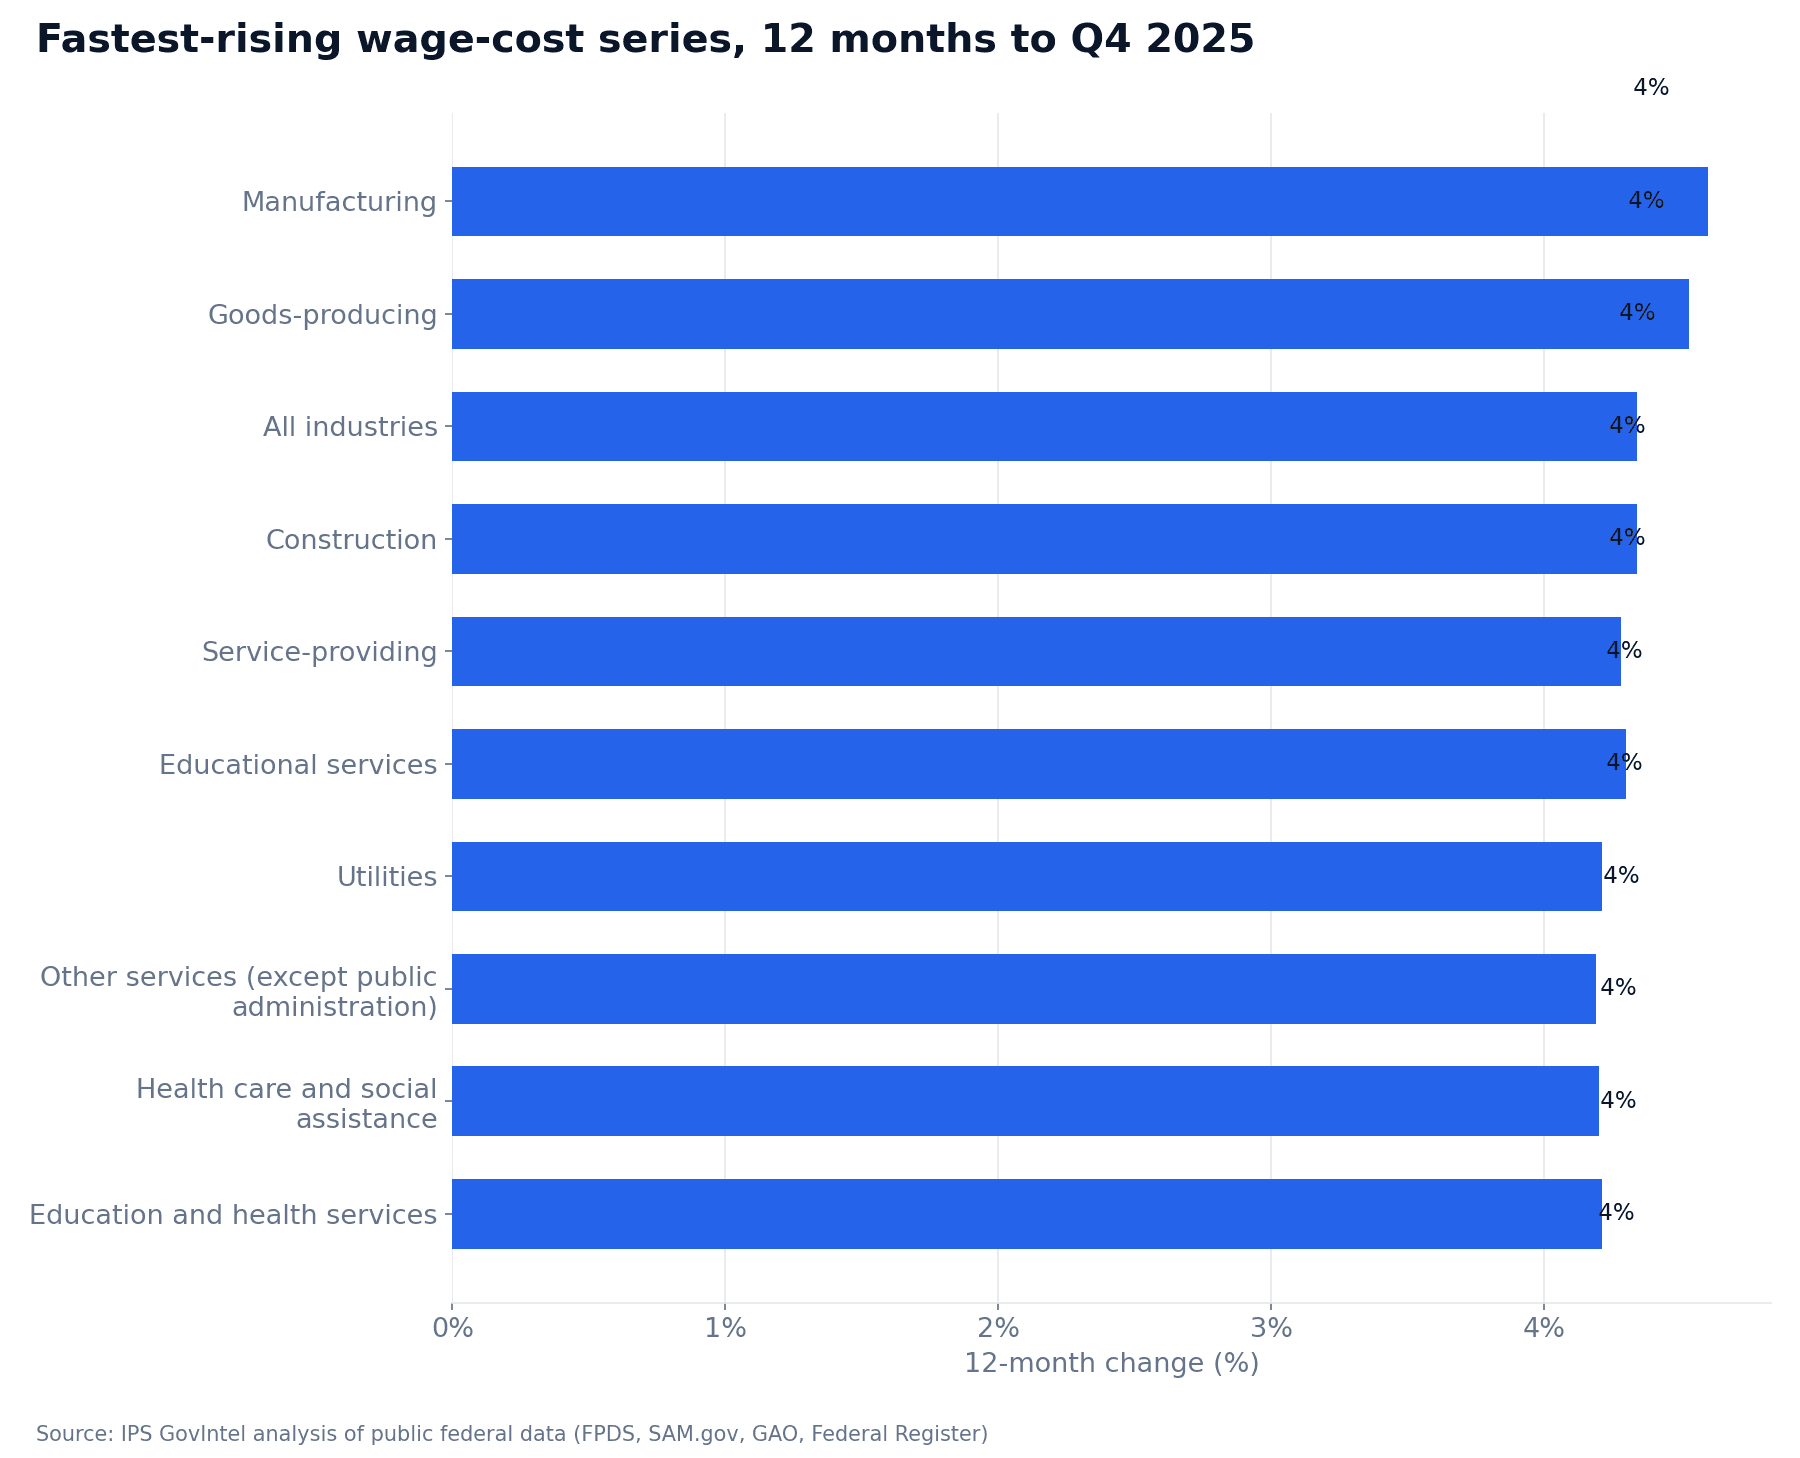
Look at the fourth line. The broad private-industry wages-and-salaries series, the closest thing to "what it costs to pay people in the private sector", rose 4.34%. That's almost a full point above the all-series median, which includes benefit-cost series and slower-moving segments.
What this data can't show: the ECI doesn't break out people who work on federal contracts. There's no series for cleared systems engineers in Northern Virginia or logisticians supporting a depot. You have to pick the closest series and accept that it's a proxy. That's fine. A defensible proxy beats an inherited guess.
The federal pay signal is misleading (for you)
Here's the GS-13, step 5, Washington-Baltimore locality, year over year:
| Year | Annual | Hourly | Change | |---|---|---|---| | 2022 | $121,065 | $58.01 | n/a | | 2023 | $126,949 | $60.83 | 4.86% | | 2024 | $133,692 | $64.06 | 5.31% | | 2025 | $136,658 | $65.48 | 2.22% | | 2026 | $138,024 | $66.14 | 1.0% |
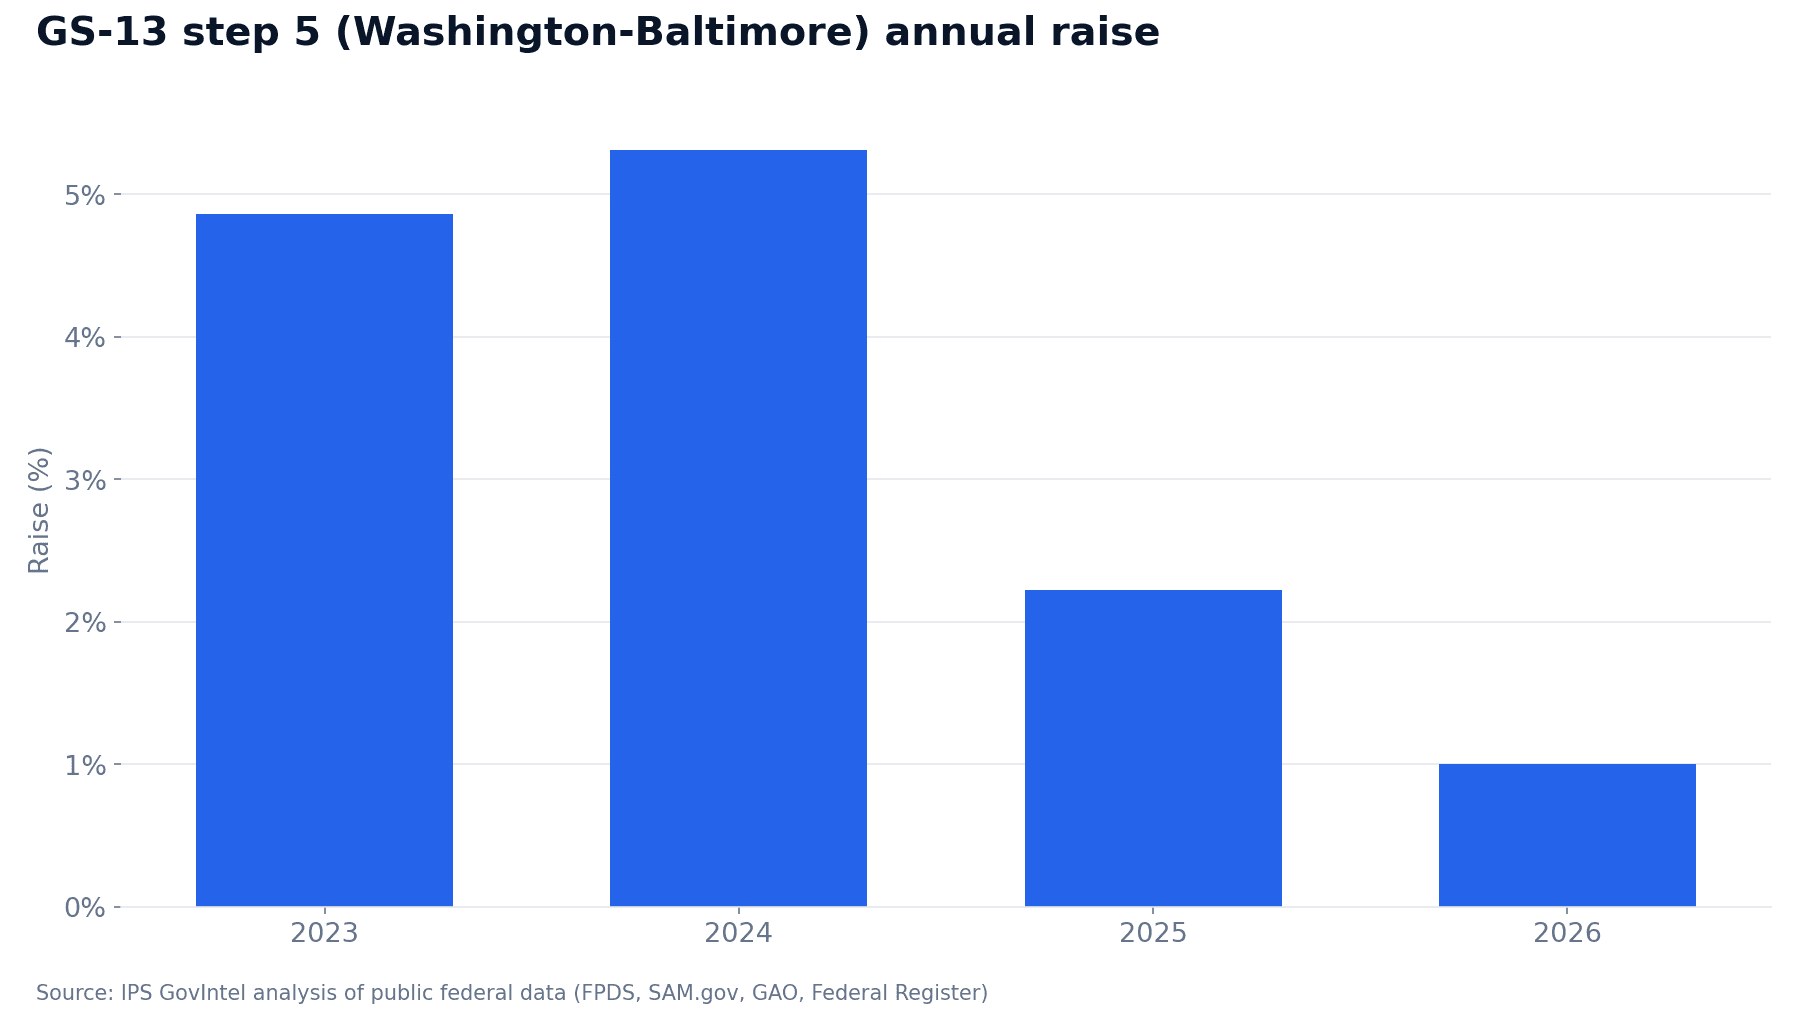
In 2023 and 2024, this GS raise ran ahead of the ECI median (4.19% and 3.79% at Q4). In 2025 and 2026 it fell behind. The 2026 raise of 1.0% is less than a third of the Q4 2025 median.
Why does that matter to a contractor? Government cost estimators and price evaluators work inside a federal pay system that just gave 1%. I can't tell you what any given evaluator thinks, but it's reasonable to expect a 3.5% escalation factor to get a closer look next to that number. It isn't rich. It's about what private wage data shows. But you'll need to show your work.
The flip side is a trap: don't use the GS raise as your benchmark. You aren't hiring from the GS pool, and you aren't competing against GS pay to keep your people. You're competing against commercial employers in your labor market.
Where ceiling rates fit
I wanted to put GSA CALC+ ceiling-rate movement next to these numbers. The rate-history data we hold isn't deep enough to measure year-over-year schedule movement with confidence, so I'm not going to guess. When we can measure it properly, I'll write it up.
The general point doesn't need that data. Where escalation is fixed at proposal or modification and then left alone, it can drift away from the market. The ECI updates every quarter. If your locked-in factor sits a point or two below actual wage growth, the shortfall compounds in every option year.
What to do with this
- Pick your ECI series on purpose. Match it to your workforce (industry, wages vs. total comp, private industry) and write down which series and which quarter you used. Q4 2025 is the latest reading in our data.
- Stress-test anything under roughly 3.4%. That's the all-series median for Q4 2025, and the broad private-industry wage series was at 4.34%. If you're below both, you need a reason other than "that's what we used last time."
- Put the source in your basis of estimate. A factor tied to a named BLS series is easier to defend in a price-reasonableness review than a round number.
- Don't anchor on the GS raise, but be ready to explain it. Keep a one-paragraph answer for why contractor labor escalation runs above the 1.0% federal raise.
- Re-check every quarter. The median has trended down for three years. If it keeps falling, you may be able to sharpen option-year pricing. If it turns, you want to know before you lock in the next five years.
Escalation is the pricing assumption you set once and live with the longest. Set it from the data, not the spreadsheet you inherited.
Want this kind of read on your own pipeline or market? Get in touch.
Topics
Josh Parker
Founder of Indy-Pendent Solutions and flowState Software. Former Air Force combat rescue pilot, defense program manager, and capture strategist with 20+ years in defense acquisition.
Need help with your next capture?
Our software tools can help you win more government contracts.