In the first quarter of FY2026 (October through December 2025), just 1.2% of new federal awards were time-and-materials or labor-hour. In the same quarter of FY2022, it was 2.8%. The peak quarter in our data, July–September 2022, hit 3.9%.
Over the same period, firm-fixed-price reached 89.0% of new awards in that quarter. That's the highest quarterly share in the four and a half years we track in GovIntel, our federal contracting data warehouse.
One caution up front: the next quarter (January–March 2026) came back to 2.0% hourly and 87.7% fixed price. So this isn't a straight line. It is a clear drift, though.
Most small firms think of pricing type as a box on the solicitation cover page. It isn't. It sets who carries the risk, how fast you get paid, and how much the contract can grow after award. Q4 of the federal fiscal year starts today, and it's the busiest award season. It's worth knowing what the baseline looks like.
Data window: base awards dated October 1, 2021 through April 2, 2026. DoD award data lags about 90 days, so the most recent quarter is incomplete, and the April 2026 sliver (a couple of days) shouldn't be read as a trend. Pricing type is coded at the base award. Individual task orders under a vehicle can differ.
💡 From the GovIntel desk this week
- $226.8 billion — DoD obligations Oct 2025 to Apr 2, 2026, up 11.5% on the same window a year earlier. DoD data lags about 90 days.
- +245% — Homeland Security obligations reached $30.2 billion FYTD through Apr 2, versus $8.8 billion a year earlier. Big swings can reshape where work appears.
- $12.0 billion — general small business set-aside obligations FYTD to Apr 2, up slightly from $11.8 billion. 8(a) sole-source fell to $2.8 billion from $3.2 billion.
- 2,287 — small business set-aside notices (solicitations, presolicitations, sources sought) posted in the week ending July 1, up from 1,709 the prior week.
- 19 of 30 — GAO protest decisions in the four weeks to July 1 were outright denials; only one was sustained in part. A short window, but the odds were long.
- $100.2 billion — FY2027 defense-wide RDT&E request, about double the prior request's $42.8 billion. Research-focused firms should watch how Congress treats it.
Data as of July 1, 2026, from IPS GovIntel: federal awards, opportunities, protests, rules and budgets, updated daily.
The mix is moving toward fixed price
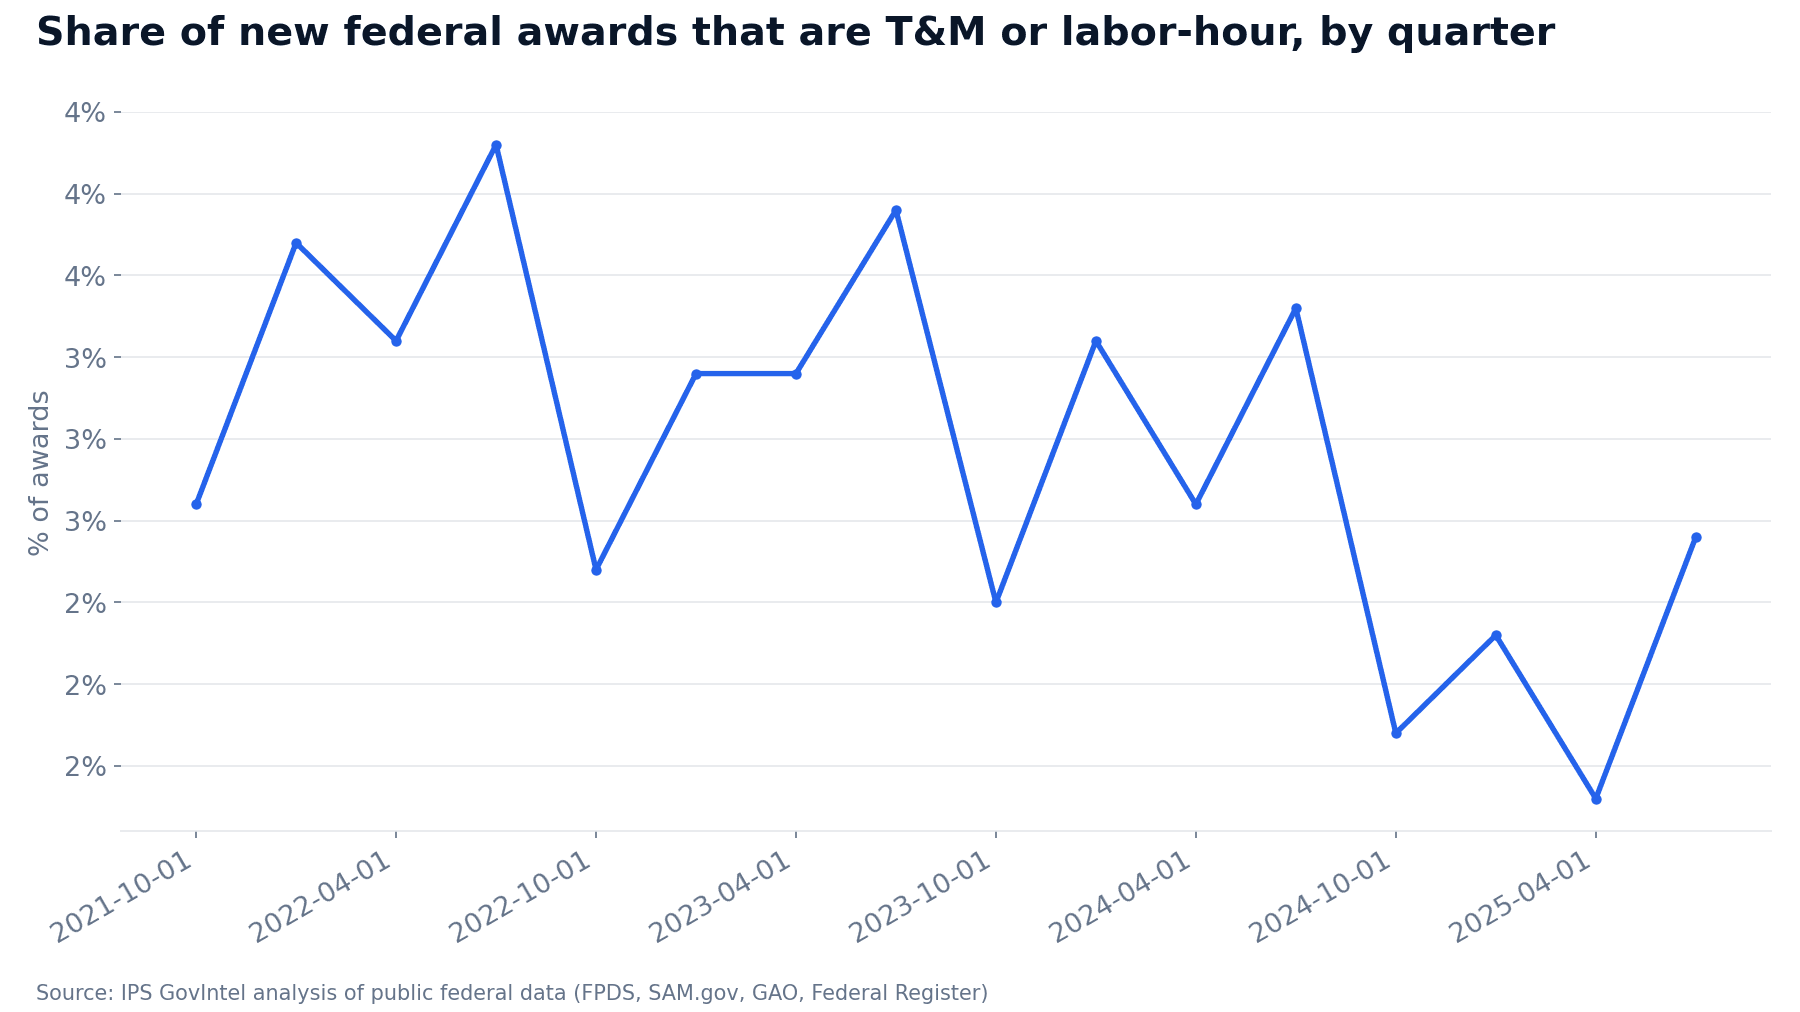
Hourly awards peak in the July–September quarter every year (3.9% in FY2022, 3.7% in FY2023, 3.4% in FY2024, 2.7% in FY2025), and each peak is lower than the one before. Cost-type awards (cost-reimbursement without a fixed-price element) have stayed at or below 1.1% of awards in every quarter and have been at 0.5–0.7% since late 2024.
A like-for-like comparison, October 1 to April 2 each year, tells the same story. Time-and-materials made up 1.6% of awards in FY2024 and 1.1% in FY2025. Labor-hour went from 1.3% to 1.1%.
Dollars are more mixed. In FY2022, firm-fixed-price base awards totaled $230.2 billion, against $14.5 billion for cost-plus-fixed-fee. In FY2023, firm-fixed-price rose to $241.2 billion and cost-plus-fixed-fee climbed to $19.3 billion. Cost-type work gets fewer awards, but each one is bigger. The median cost-plus-fixed-fee base award in FY2025–FY2026 YTD was about $716,000, compared with $189,000 for firm-fixed-price.
Who still buys by the hour
The government-wide average hides a lot of variation. For FY2025 through April 2, 2026 (agencies with 200+ awards):
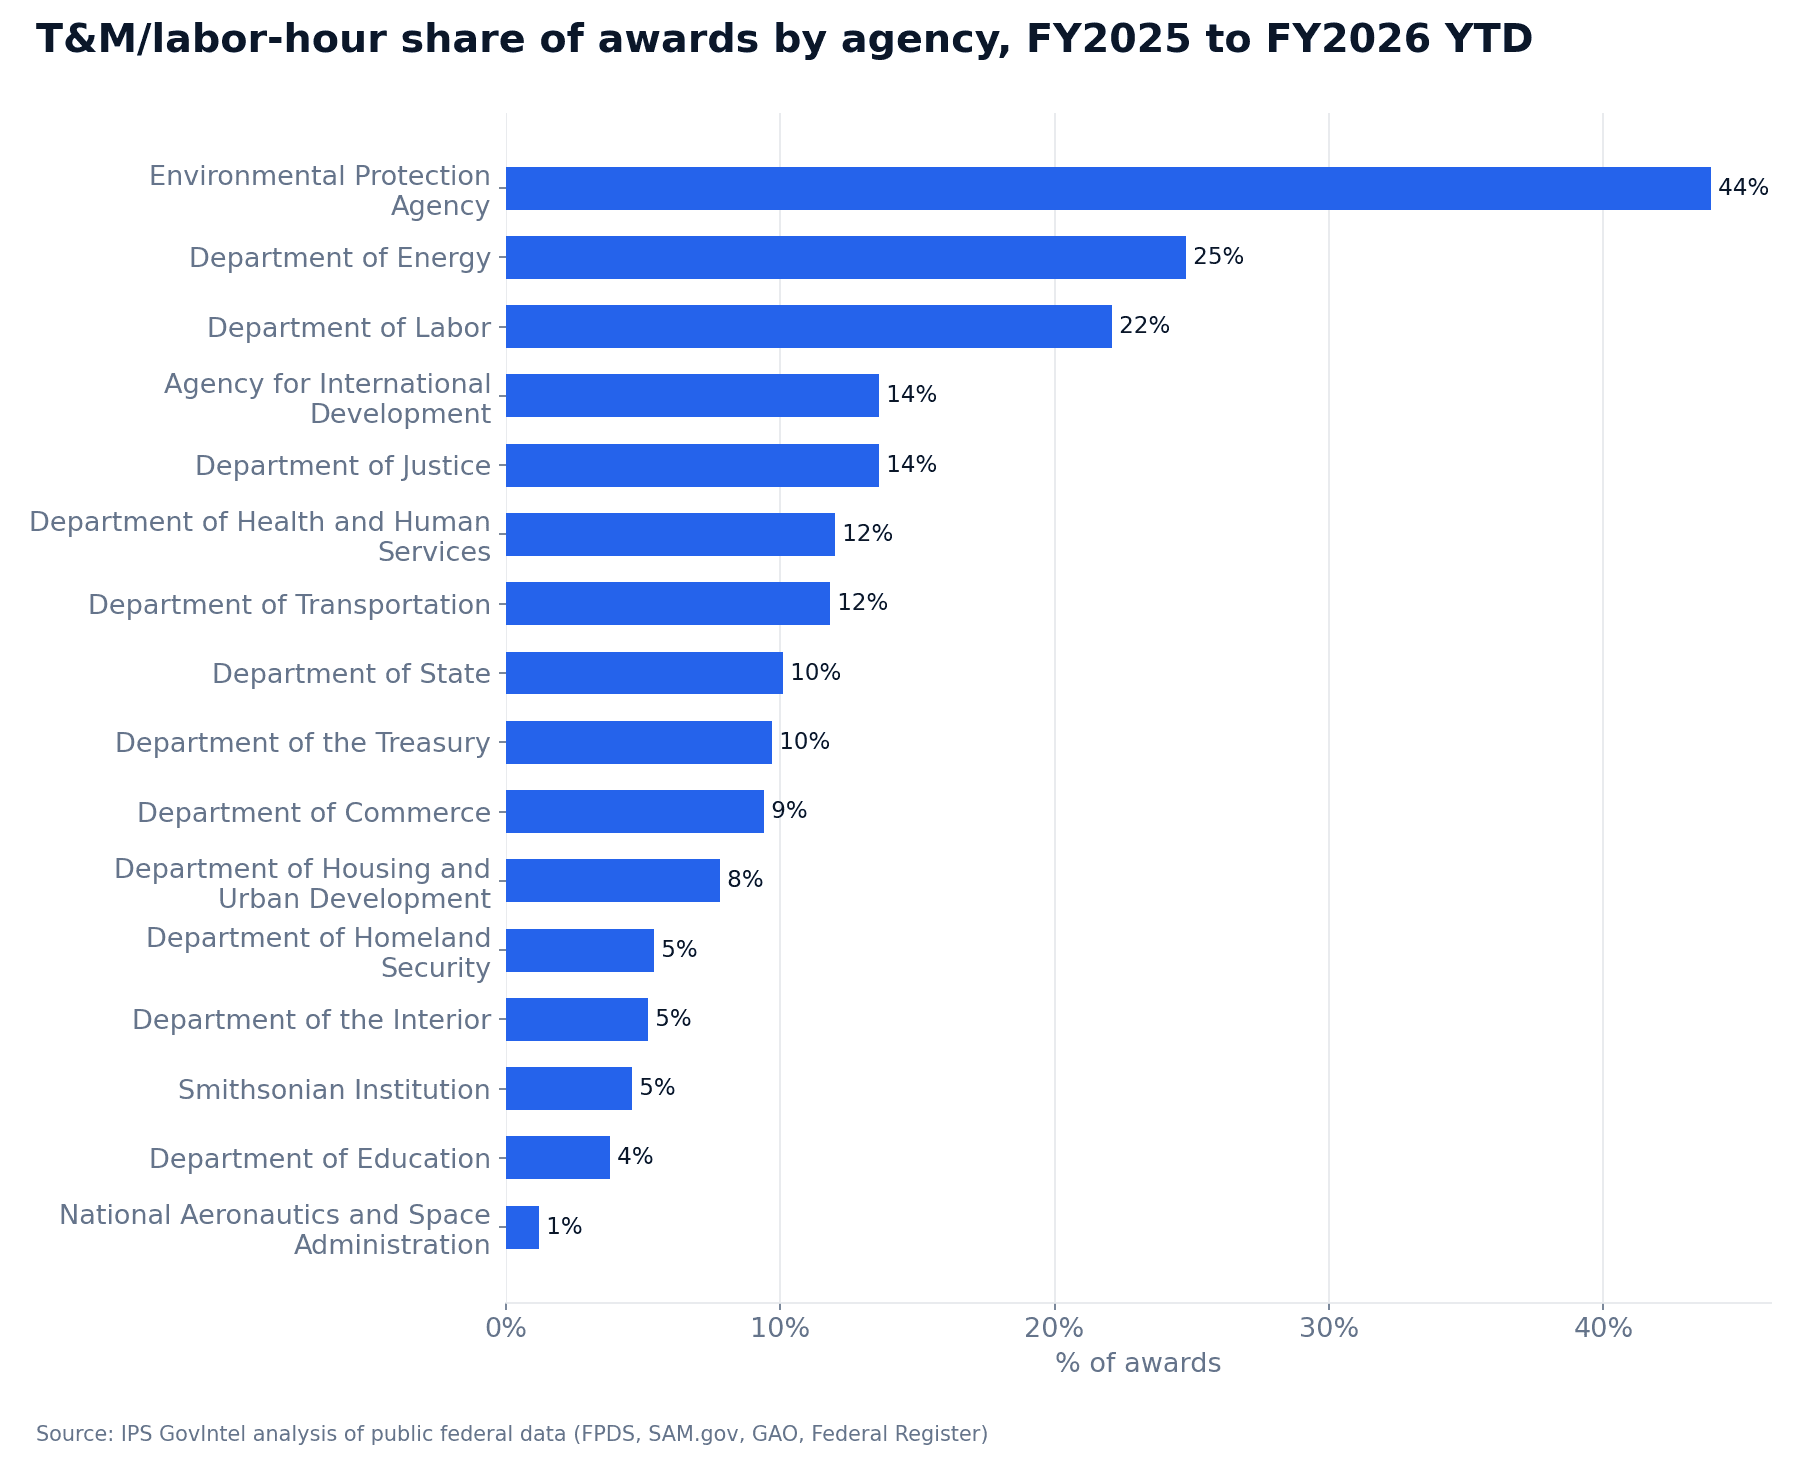
- EPA: 43.9% of awards were T&M or labor-hour (551 of 1,254).
- Energy: 24.8%. Labor: 22.1%.
- Justice: 13.6%, which is 1,123 hourly awards, the largest count of any agency on the list.
- HHS: 12.0%. Transportation: 11.8%, plus another 10.3% cost-type.
- USAID: 23.1% cost-type, the highest cost-reimbursement share in the set.
At the other end, DoD made 196,866 awards in the window and only 0.3% were hourly. VA was at 0.1%, Agriculture 0.1%, and GSA 1.0%. If you've only ever sold to DoD or VA, the government probably looks entirely fixed-price to you. Several civilian agencies don't buy that way.
By service category, ranked by T&M/labor-hour base obligations, application development support (PSC DA01) leads at $1.59 billion across 329 awards. Then come other professional support (R499, $1.15 billion over 924 awards), program management support (R408, $781 million) and engineering and technical support (R425, $365 million). My read is that these are areas where scope is hard to pin down up front, which is why agencies still pay by the hour. The data shows where the hourly dollars are, not why.
Hourly awards draw fewer bidders
In FY2025–FY2026 YTD, time-and-materials awards were full-and-open 69.0% of the time, yet the median number of offers was 1.0. Labor-hour was the same at 1.0. Firm-fixed-price and cost-plus-fixed-fee both had a median of 2.0.
My opinion is that this is a capability filter. Many small firms don't bid hourly or cost-type work because they don't have the systems for it: compliant timekeeping, a defensible rate build-up and, for cost-type, an adequate accounting system. The data can't confirm that. It only shows the thin field.
Most set-aside work is fixed-price. Total small business set-asides were 92.4% firm-fixed-price, 0.7% T&M/labor-hour, and 0.0% cost-type. SDVOSB set-asides were 94.9% firm-fixed-price. Unrestricted awards were 83.3% firm-fixed-price and 2.8% hourly where no set-aside was coded, and 87.6% and 1.5% where the record says "no set-aside used."
The exceptions are worth a look. 8(a) sole source awards were 4.3% hourly, 8(a) competed awards 4.7% (and only 47.3% firm-fixed-price), and Indian Small Business Economic Enterprise awards 11.7%.
What happens after award
This is the part that should shape how you plan capacity. For base awards from October 2021 through March 2025 (so they've had time to grow):
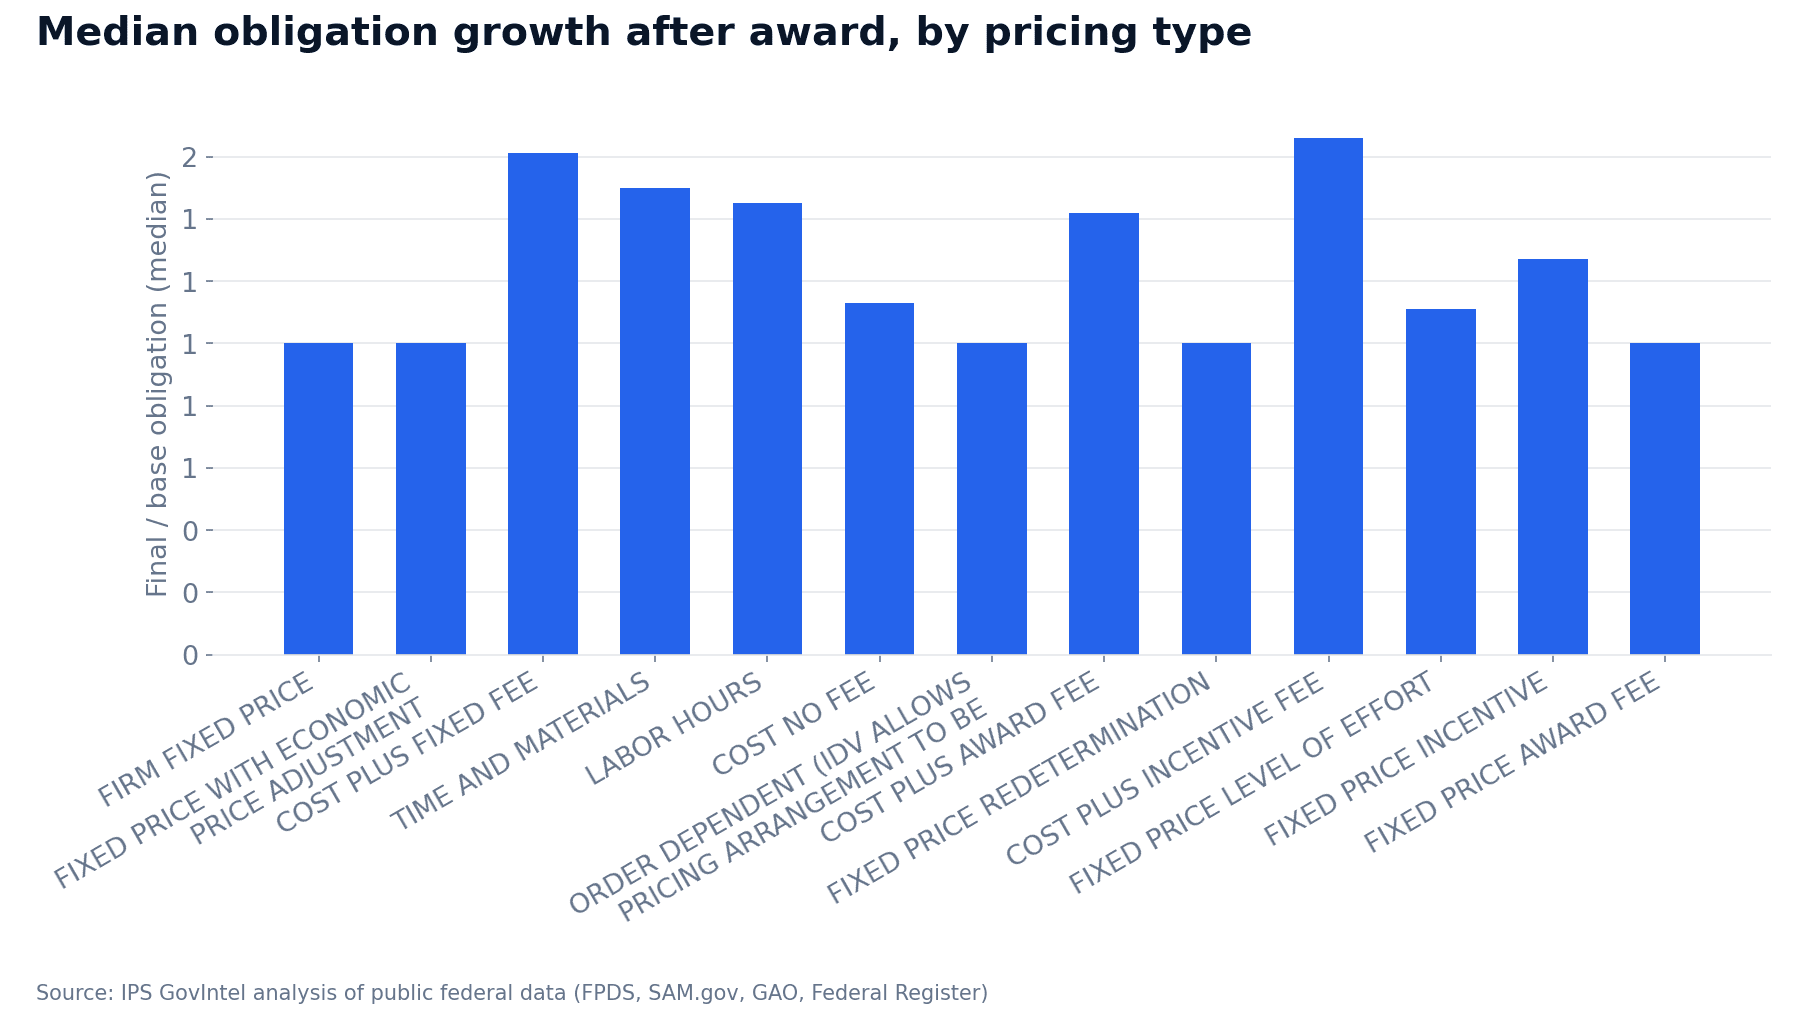
The median firm-fixed-price award ended at 1.0 times its base obligation, with 1.7 modifications on average. Even the 75th percentile was 1.0x. Most fixed-price awards don't grow.
Hourly and cost-type awards do:
- Cost-plus-fixed-fee: median growth 1.61x, 75th percentile 4.13x, 6.7 mods on average.
- Time-and-materials: median 1.5x, 75th percentile 3.45x.
- Labor-hour: median 1.45x, 75th percentile 3.07x.
- Cost-plus-incentive-fee: median 1.66x, 75th percentile 4.87x, 11.2 mods.
A quarter of cost-plus-fixed-fee awards end up at more than four times their starting value. That's good for revenue, but you have to staff it, finance it, and keep track of every modification. On fixed-price work, margin depends mostly on your price at award, because the contract usually stays close to its starting value.
What the data can't tell you is why awards grow. Exercised options, added scope and plain overruns all look the same here.
What to do with this
- Map your target agencies against the hourly-share list. If your pipeline leans on EPA, Energy, Labor, Justice or HHS, expect T&M or labor-hour terms. Make sure your timekeeping and labor-category mapping will hold up in an audit.
- Build your fixed-price model now. In small business set-aside work, over 92% of awards are firm-fixed-price. Know your fully burdened rates, your risk reserve and your walk-away price before you write the narrative.
- Consider hourly work if you can support it. A median of one offer on T&M and labor-hour awards means the field is thin. That only helps if your accounting holds up when someone looks at it.
- Plan cash flow for growth on cost-type and hourly awards. A median of 1.5–1.6x means more people on the contract, more billing and more mods to manage. Size your line of credit for it.
- Read the pricing clause before go/no-go. It's a business decision, not a formality.
The government decides how it wants to pay. You decide whether you're set up to be paid that way.
Want this kind of read on your own pipeline or market? Get in touch.
Topics
Josh Parker
Founder of Indy-Pendent Solutions and flowState Software. Former Air Force combat rescue pilot, defense program manager, and capture strategist with 20+ years in defense acquisition.
Need help with your next capture?
Our software tools can help you win more government contracts.