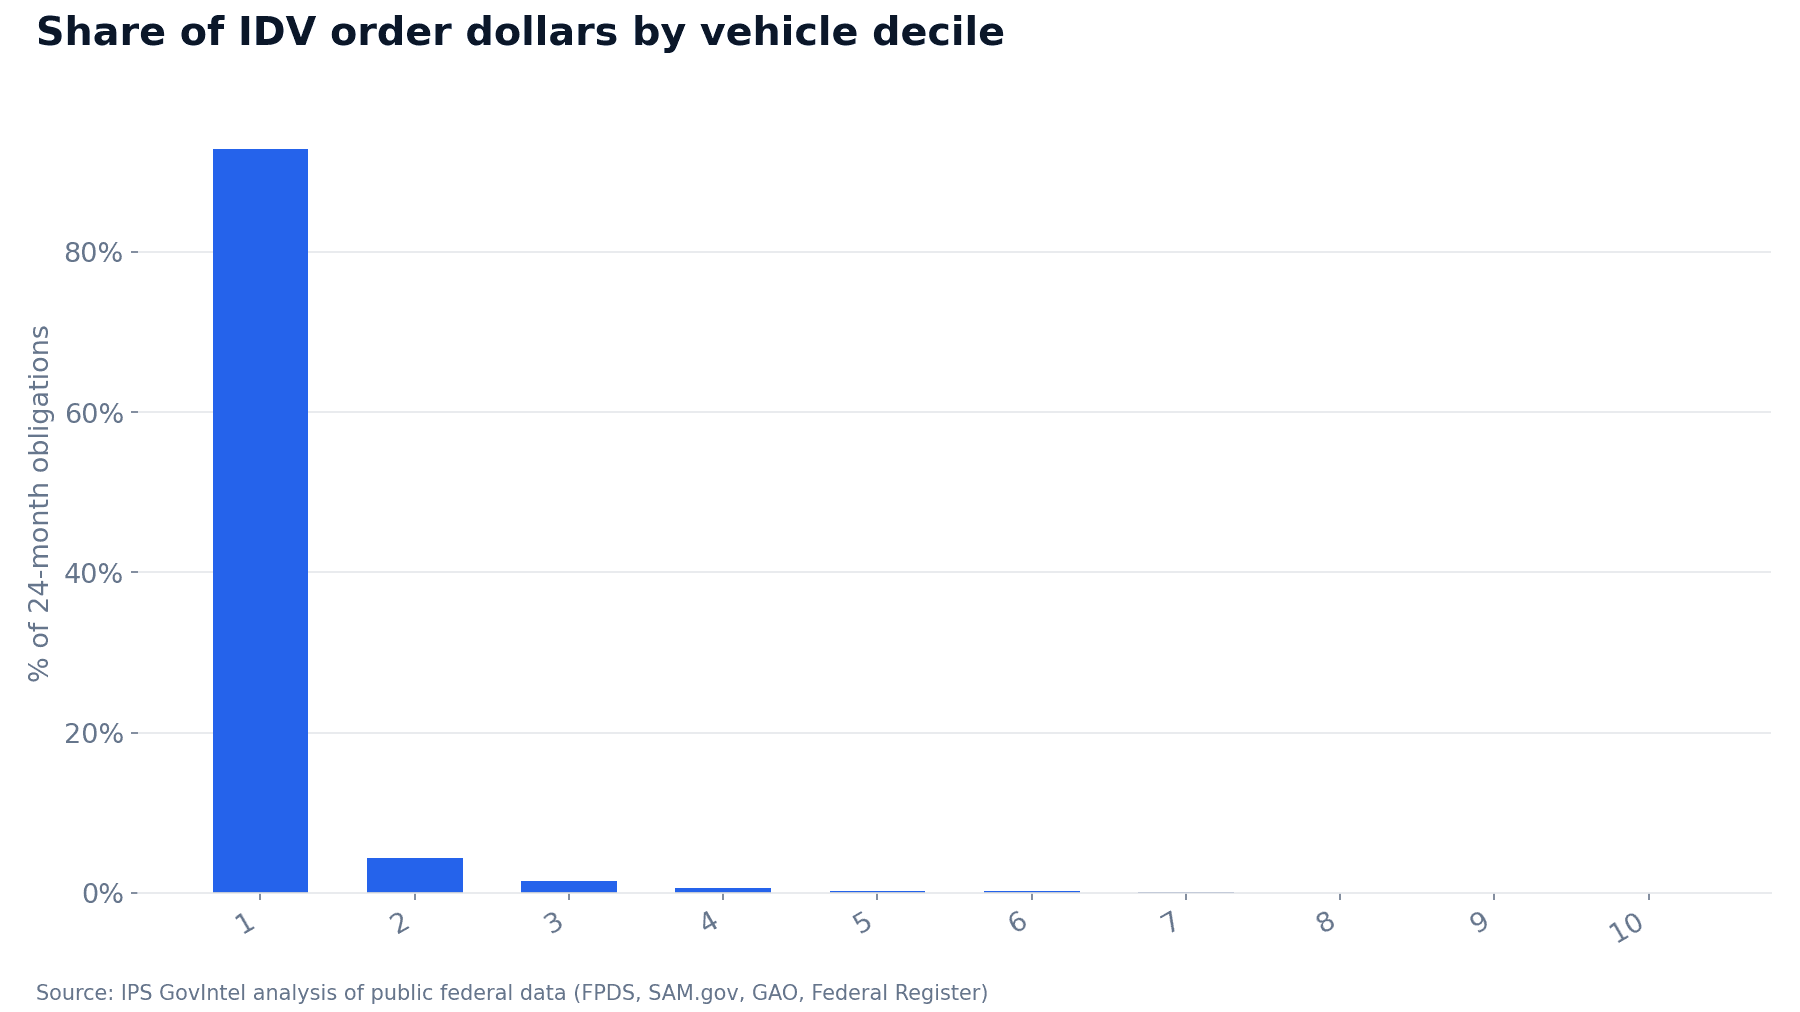
Rank every federal indefinite-delivery vehicle that saw at least a dollar of ordering, then cut the list into tenths. The top tenth (4,512 vehicles) carried $239.3 billion. That's 92.8% of the money. The bottom tenth, 4,511 vehicles, carried $13.2 million combined.
Keep that in mind next time someone celebrates an IDIQ award. Getting on the vehicle and getting paid through it are two different events, and the gap between them is wider than most pipelines assume.
Some housekeeping on the data. We track this in GovIntel, our federal contracting data warehouse. The numbers below cover IDIQs, BPAs, BOAs, schedules and GWACs first awarded through March 19, 2026, with order obligations over the trailing 24 months to that date. That cutoff exists because DoD award data runs about 90 days behind, so the most recent defense ordering is undercounted. Fiscal Q4 starts July 1, and a good share of year-end buying will likely run through vehicles that already exist. So it's worth knowing which ones actually carry orders.
💡 From the GovIntel desk this week
- $197.0 billion in DoD contract obligations in FY2026 through March 19. DoD data lags about 90 days, so recent awards are missing.
- 2,482 small business set-aside solicitations were posted in the week ending June 17, versus 786 marked no set-aside. Set-asides outnumber open postings by roughly three to one.
- 383 service-disabled veteran-owned set-aside solicitations were posted in the same week, the biggest socioeconomic category after the general small business set-aside.
- 1 of 28 GAO protest decisions in the 30 days to June 17 was sustained; 18 were denied outright. Sustains are rare.
- 30 GAO protests were filed in the week ending June 17, versus 32 the week before. Filing volume is steady, not surging.
- June 17: GSA published a proposed rule notice on information and communication technology acquisition, with listening sessions and a request for comments. Worth watching if you sell IT.
Data as of June 17, 2026, from IPS GovIntel: federal awards, opportunities, protests, rules and budgets, updated daily.
Most vehicles are quiet
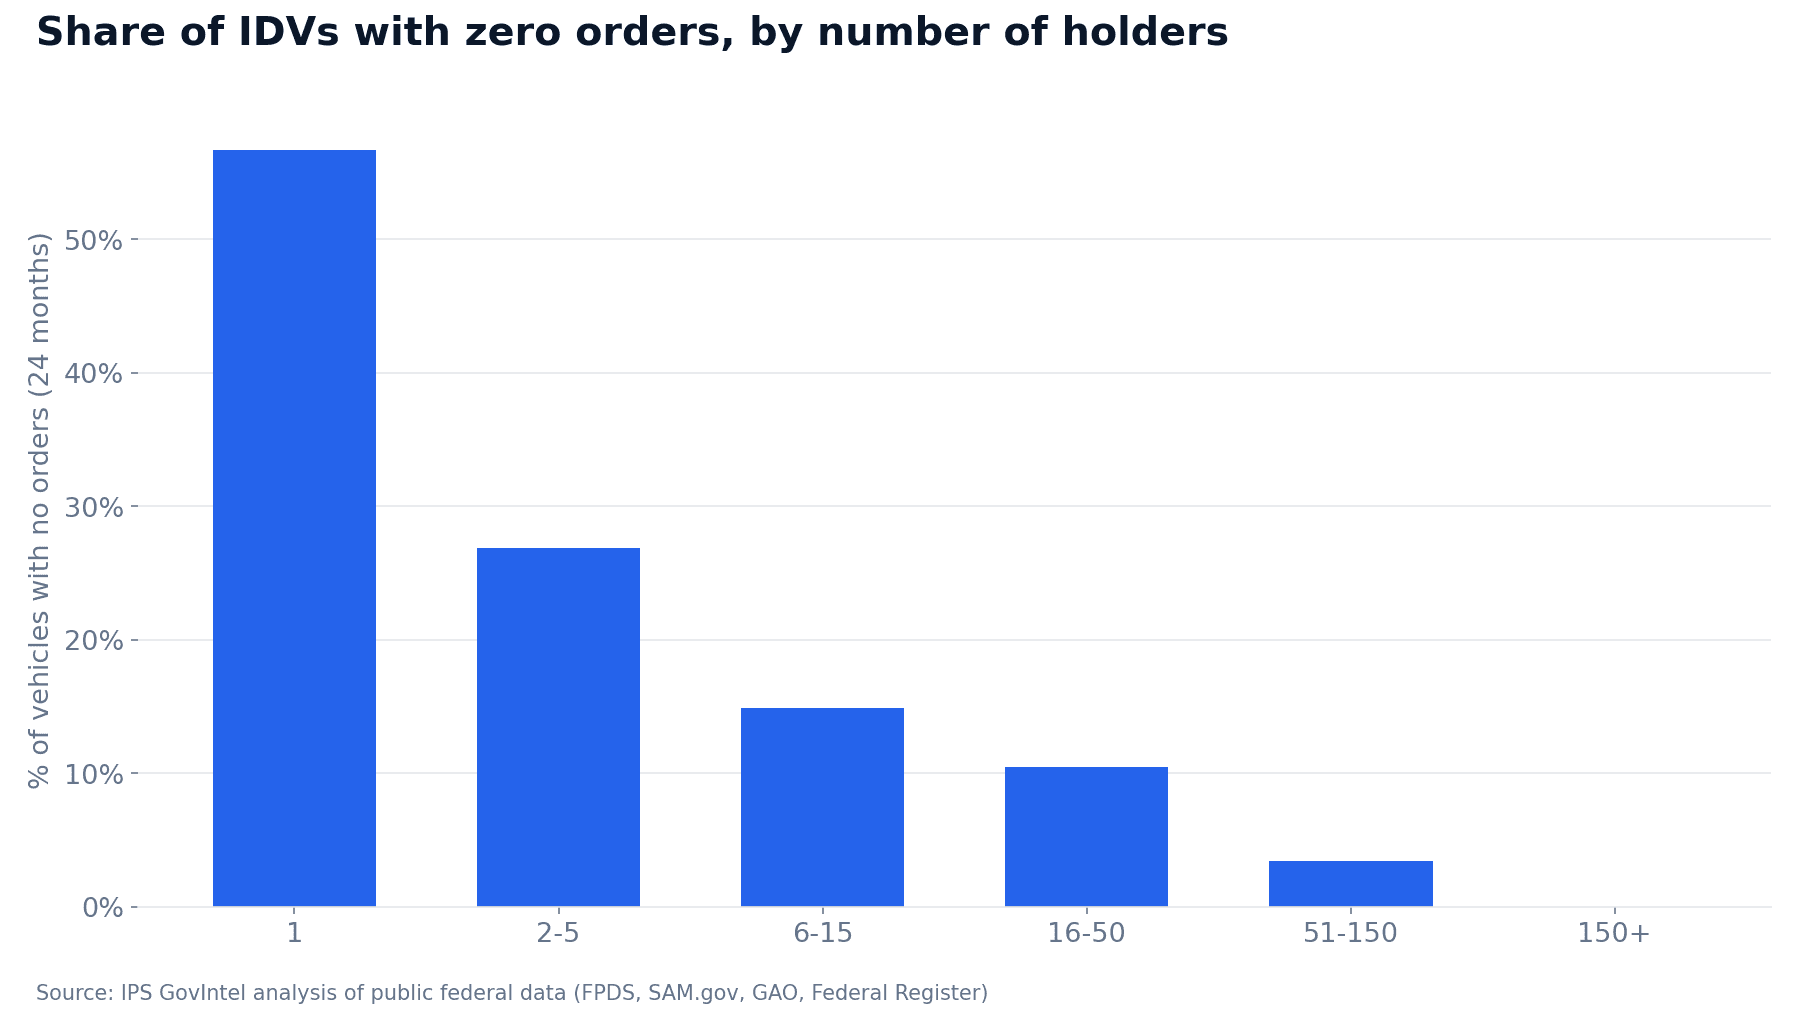
Start with the single-award vehicles, which are most of them: 97,750 vehicles with one holder, carrying $149.1 billion over 24 months. Among them, 56.7% had no orders at all in that window. The median single-holder vehicle's obligations rounded to zero.
Vehicle type tells a similar story:
- BPAs: 33,277 vehicles, 73.7% with no orders in 24 months
- FSS-type vehicles: 246 as keyed in our data, 83.3% with no orders
- IDCs (IDIQs): 66,824 vehicles, 46.2% with no orders, but $228.0 billion of the obligations
A BPA is a set of pre-agreed terms. It isn't revenue. Nearly three out of four BPAs in this data didn't produce a single order in two years.
More holders, more activity, thinner slices
The share of dormant vehicles drops steadily as holder count rises: 26.9% of vehicles with 2–5 holders had no orders, 14.9% at 6–15, 10.5% at 16–50, 3.4% at 51–150, and none of the 28 vehicles with more than 150 holders. Big multiple-award vehicles get used. That part is reassuring.
But the money gets split more ways. One Federal Acquisition Service schedule solicitation with 6,760 holders moved $3.1 billion. That works out to about $460,000 per holder if you divide it evenly. A Missile Defense Agency IDIQ with 2,439 holders moved $940.4 million, or about $390,000 per holder.
Even splits are a convenience, not a fact. The data shows how much money a vehicle moved and how many companies hold it. It doesn't show how the orders were divided, so treat these as rough averages. The median across vehicles is a better guide to the typical case:
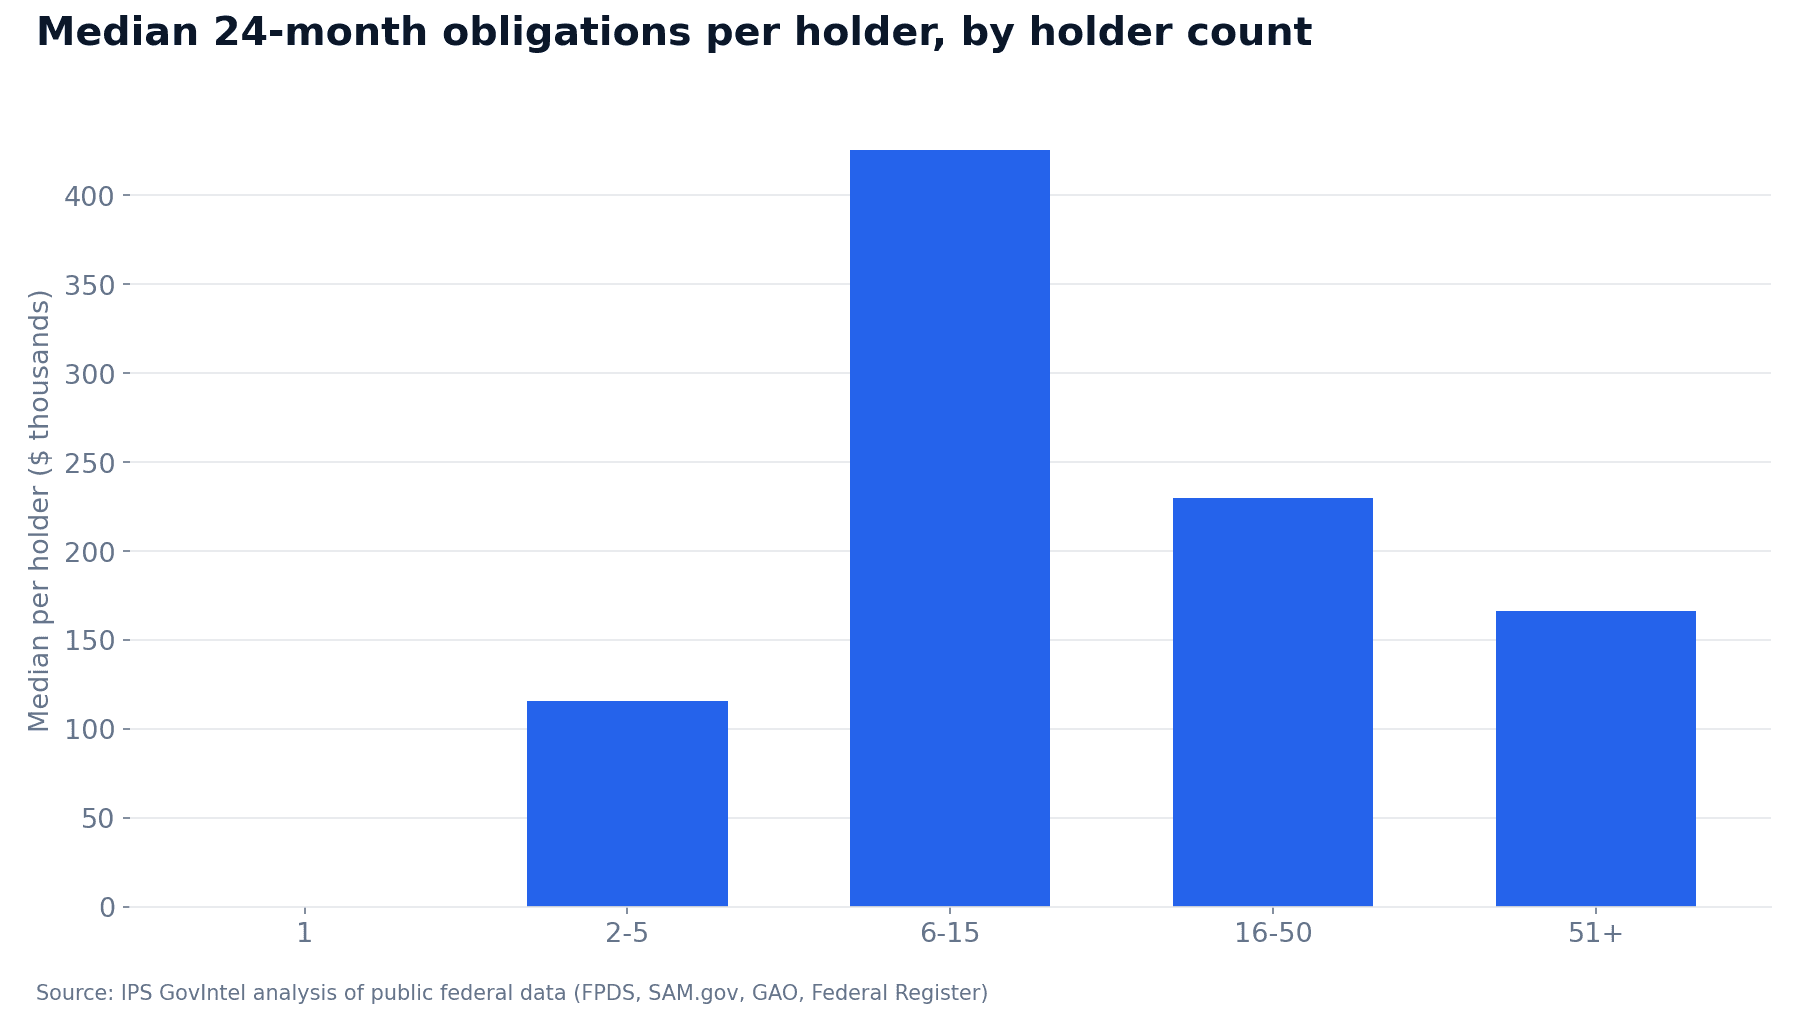
The median obligation per holder peaks at $425,600 on vehicles with 6–15 holders. It falls to $229,900 at 16–50 holders and $166,400 at 51 or more. At the 90th percentile the gap widens: $7.7 million per holder in the 6–15 bucket against $944,500 on 51+ holder vehicles.
My read is that a mid-sized pool is where the arithmetic works best for a holder. It's busy enough that orders flow, and small enough that the money isn't spread across dozens of names. On a vehicle with hundreds of holders, the contract is mostly a hunting license. You still have to find the customer, shape the order and win it.
Concentration shows up at the top, too
Look at the biggest vehicles and the pattern holds. The largest by 24-month obligations was a VA IDIQ with 4 holders and $12.1 billion. Several Customs and Border Protection single-award IDIQs each moved between $2.2 billion and $11.6 billion. Among vehicles with six or more holders, the leader was an 11-holder FAS IDIQ at $4.0 billion, roughly $364.7 million per holder on average.
The ordering agency matters as much as the vehicle. On multiple-award vehicles (2+ holders), the Defense Logistics Agency led with $26.8 billion across 588 vehicles, followed by VA ($17.3 billion), Army ($12.0 billion), Navy ($11.4 billion) and FAS ($10.3 billion). How often those vehicles went unused varied a lot:
- U.S. Coast Guard: 2.2% of its multi-holder vehicles had no orders
- Navy: 12.5%
- Air Force: 29.0%
- USTRANSCOM: 42.9%
- Agricultural Marketing Service: 63.5%
Same contract structure, very different odds of seeing a task order.
Vintage matters as well. Of vehicles first awarded in 2025, 65.0% had orders. For 2022 vehicles the figure was 27.9%. Vehicles first awarded in 2024 carried $76.7 billion, the most of any year. The data doesn't say why older vehicles go quiet. Expiration and agencies shifting to newer vehicles are the obvious suspects, but those are my guesses.
What the data can't show
A few honest limits. Holder counts come from grouping awards under a shared solicitation, so a vehicle with on-ramps or odd keying can look bigger or smaller than it is. DoD ordering from the last few months is undercounted because of the reporting lag.
The set-aside flag on orders is spotty. In FY2025, orders flagged as set-aside carried $23.57 billion, against $434.27 billion with no set-aside recorded. Orders may not carry their parent vehicle's set-aside status, so don't read that as the true small-business share. And none of this tells you which holders won the orders.
What to do with this
- Pull the order history before you bid an on-ramp. Look at 24-month obligations and holder count for that solicitation. If it's a BPA or a crowded schedule with little ordering, price your proposal effort accordingly.
- Favor vehicles with 6–15 holders where you have a choice. In this data that's where the typical holder's slice is largest.
- Treat big multiple-award vehicles as access, not revenue. Budget BD hours for task-order capture on any vehicle with 50+ holders, or the contract will likely sit idle for you.
- Before July 1, sort your existing vehicles by ordering agency. Put your Q4 outreach toward the offices that actually placed orders through them, not every agency allowed to use them.
- Keep unordered vehicles out of your pipeline value. Until an order lands, a ceiling is just a number.
A seat on the vehicle is the ticket. The orders are what you actually get paid for.
Want this kind of read on your own pipeline or market? Get in touch.
Topics

Josh Parker
Founder of Indy-Pendent Solutions and flowState Software. Former Air Force combat rescue pilot, defense program manager, and capture strategist with 20+ years in defense acquisition.
Need help with your next capture?
Our software tools can help you win more government contracts.