In awards from FY2022 through FY2024, 77.6% never grew past their base obligation. Among awards where the government exercised two options, 83.7% at least doubled.
Both numbers come from the same dataset, and you need both to forecast. The typical award is the number on the award document and nothing more. A smaller group ends up worth several times what was obligated on day one. If your FY2027 forecast treats every win the same way, it's wrong in one direction or the other.
It's mid-May, the back half of Q3 in FY2026. Option exercises and year-end funding are coming, and small firms are building next year's revenue plan and deciding which bids deserve B&P money. So I pulled award-level growth data from GovIntel, our federal contracting data warehouse, to see how much of a contract's value arrives after the base award.
💡 From the GovIntel desk this week
- $4.1 billion of DHS obligations in the 30 days to Feb 12, versus $1.5 billion a year earlier (DoD-reported data lags ~90 days).
- $2.1 billion in total small-business set-aside obligations in the 30 days to Feb 12, down from $2.4 billion a year earlier.
- 22 new 8(a) set-aside notices posted in the week to May 13, up from 10 the week before; SDVOSB notices rose to 17 from 9.
- 7 of 15 GAO protest decisions in the four weeks to May 13 were denied; 4 were dismissed and 2 were sustained in whole or in part.
- $30.4 billion FY2027 request for Defense Production Act purchases, versus $266 million in the prior request.
- DFARS Case 2021-D011: a May 7 proposed rule on mitigating risks related to foreign ownership, control, or influence.
Data as of May 13, 2026, from IPS GovIntel: federal awards, opportunities, protests, rules and budgets, updated daily.
Most Awards Stay Flat, and a Few Grow Several Times Over
The measure is simple: total obligations to date divided by the obligation at award. It covers awards with a positive base obligation. The main comparisons use the FY2022–FY2024 cohorts, which have had time to mature. Award data runs through February 12, 2026. DoD reporting lags about 90 days, and DoD accounts for 322,370 of the mature awards, so the newest activity is undercounted.
For FY2022–FY2024 awards:
- 77.6% showed no growth at all (1.0x or less)
- 7.8% grew up to 1.25x
- 5.7% grew 1.25x to 2x
- 6.7% grew 2x to 5x
- 2.2% grew more than 5x
The median growth multiple was 1.0x in every cohort. The mean is misleading. It reached 3,939.98x for FY2024 because a few awards with tiny base obligations later took on large modifications. Plan around the median and the shares, not the average.
The dollars aren't shaped like the counts. The 2.2% of awards that grew more than 5x add up to $103.7 billion in total obligations. That's about the same as the 7.8% that grew modestly ($105.2 billion).
Recent cohorts are still growing. The share that at least doubled falls from 11.2% for FY2022 to 7.3% for FY2024, 3.9% for FY2025 and 1.0% for FY2026. The share with no modifications rises from 43.9% (FY2022) to 87.0% (FY2026). Contracts didn't suddenly stop growing. The newer ones just haven't had time.
Options Drive the Growth
The strongest signal in the data is option exercises.
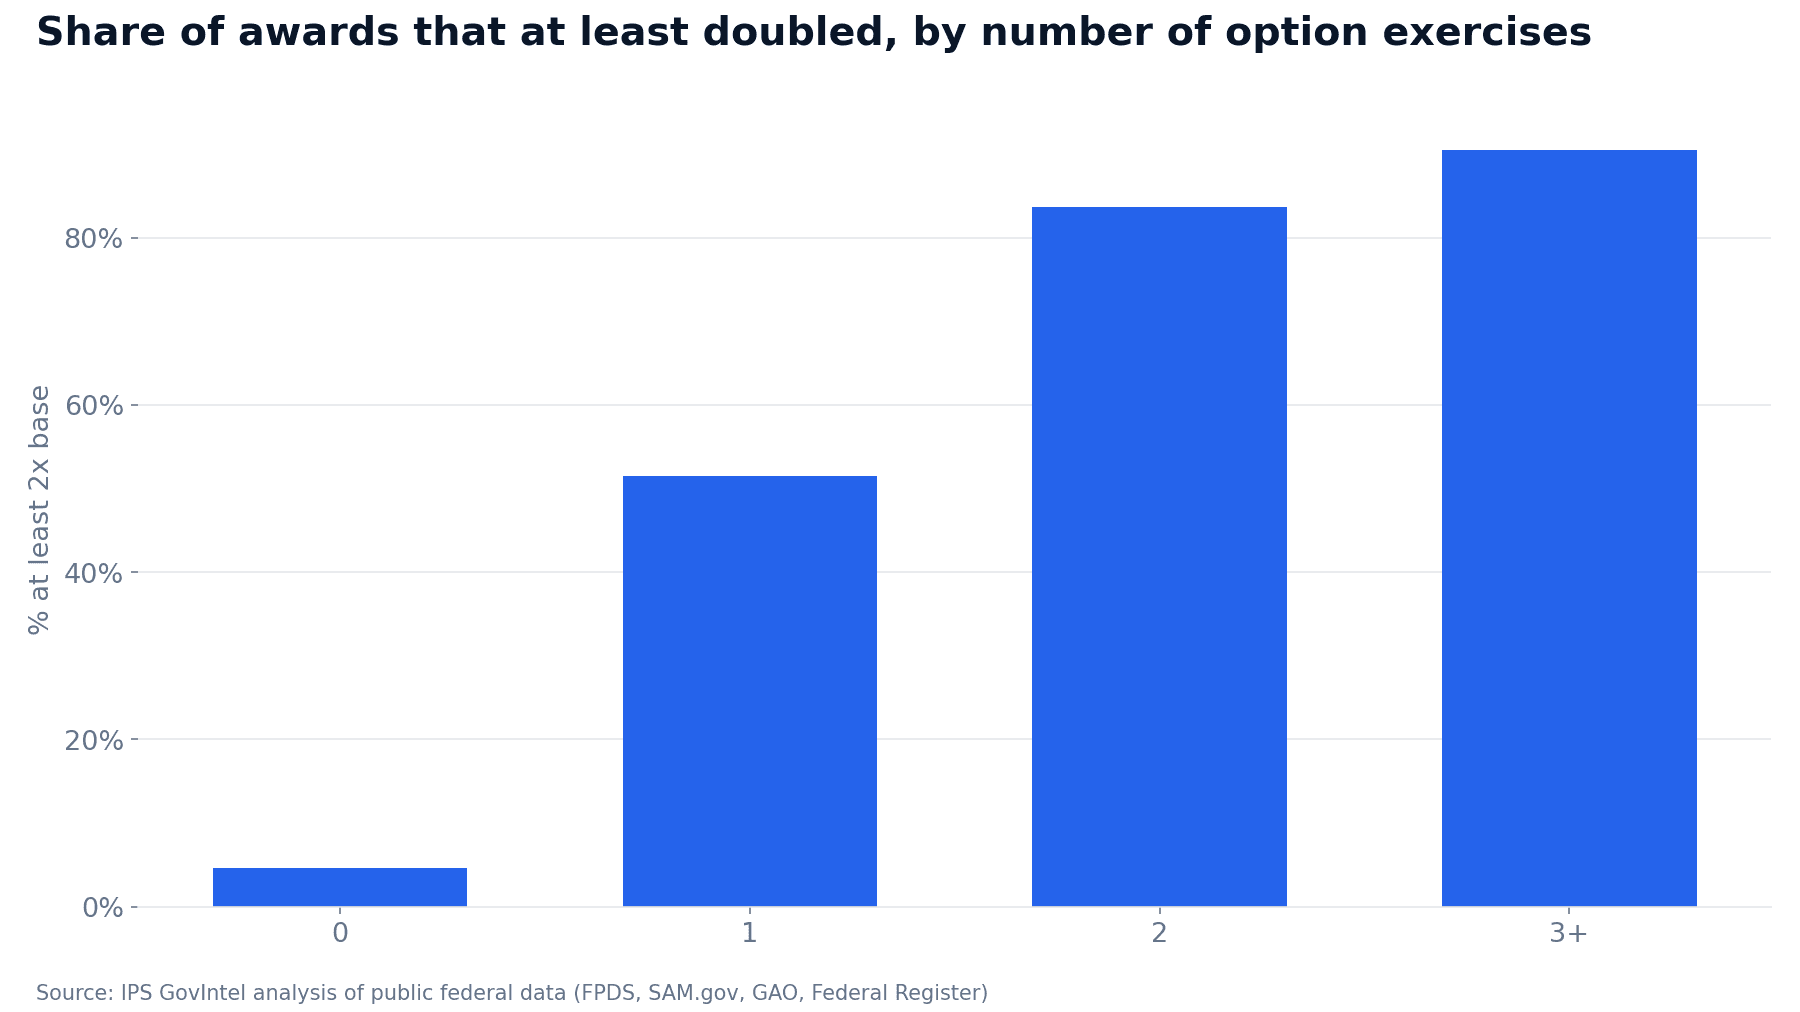
Awards with no exercised options (494,146 of them) had a median growth of 1.0x, and only 4.6% doubled. One option exercise moves the median to 2.0x, with 51.5% at least doubling. Two options: median 3.03x, 83.7% doubled. Three or more: median 4.15x, 90.5% doubled.
None of this will surprise anyone who has run a program. It still matters for forecasting. If an award has priced option years, the base obligation tells you very little about what it will pay. If it has no options, the base obligation is probably close to the whole contract. Before you forecast an award, figure out which kind it is.
Pricing type shows the same split.
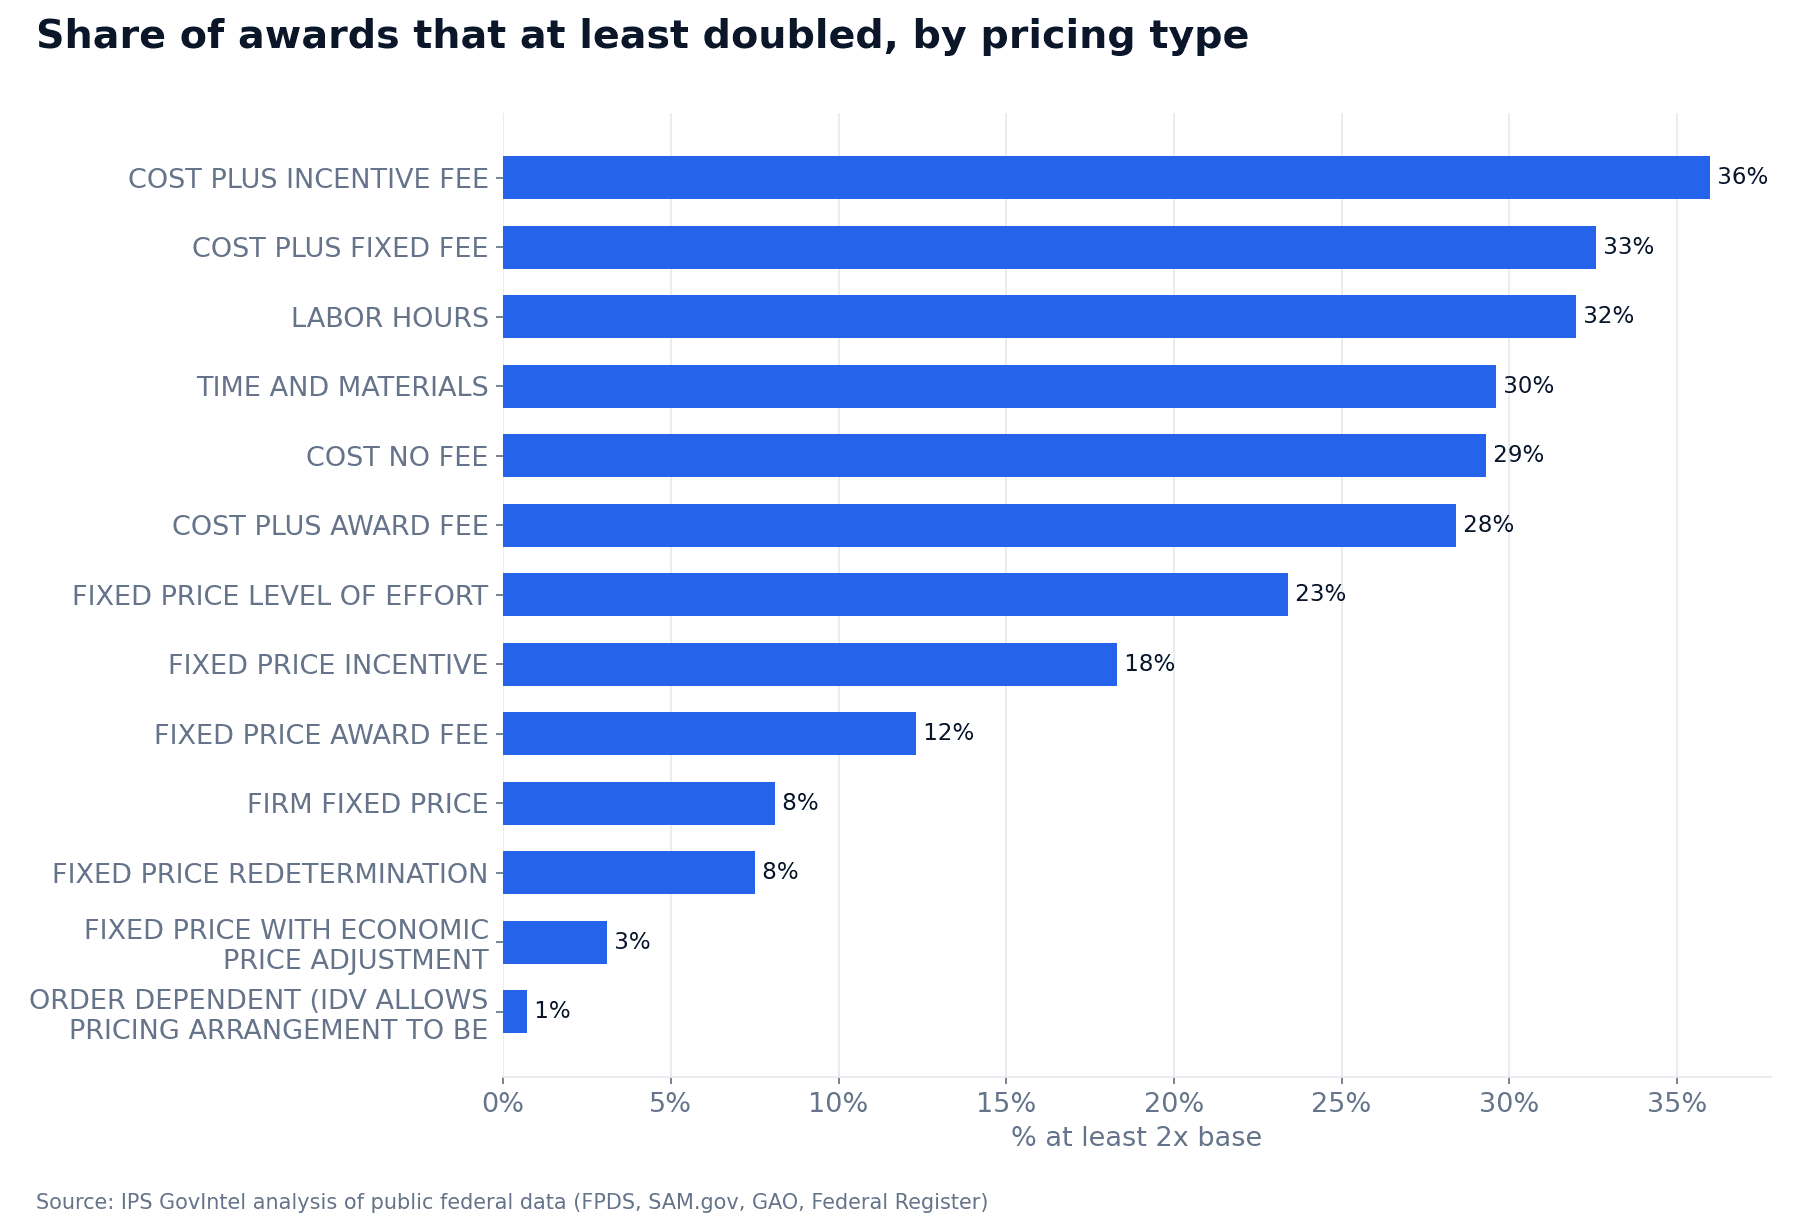
Firm-fixed-price awards are the bulk of the mature set (473,796). They had a median of 1.0x, 8.1% doubled, and they averaged 1.3 modifications. Cost-plus-fixed-fee awards had a median of 1.13x, 32.6% doubled, and they averaged 3.8 mods. Labor hours (32.0% doubled), time-and-materials (29.6%) and cost-plus-incentive-fee (36.0%, with 7.6 mods on average) look similar. Services work that gets funded incrementally behaves differently from a fixed-price delivery. Your cash plan should account for that.
Set-Aside, Size and Agency
Set-aside. Small business set-asides didn't grow any more than unrestricted awards. Total small business set-asides doubled 8.1% of the time. Awards with no set-aside recorded doubled 8.4% of the time, and those flagged "no set-aside used" doubled 11.6%. The outlier is 8(a) sole source: 22.6% doubled, and its median base obligation ($457,178) was more than twice that of total small business set-asides ($196,103). Women-owned small business (16.8%), SDVOSB sole source (16.0%) and 8(a) competed (15.3%) were also higher, but those groups are small (under 1,300 awards each), so read them as directional.
Base size. For awards with a base obligation of $100K or more, I expected small awards to grow the most in proportion. They didn't. Awards with a $100K–$250K base doubled 4.6% of the time, and 17.3% of their dollars came after the base. Awards with a $1M–$5M base doubled 10.5% of the time, and 26.8% of their dollars came after the base. The $5M+ group came in at 10.0% and 21.1%.
Agency. This is where the spread is widest.
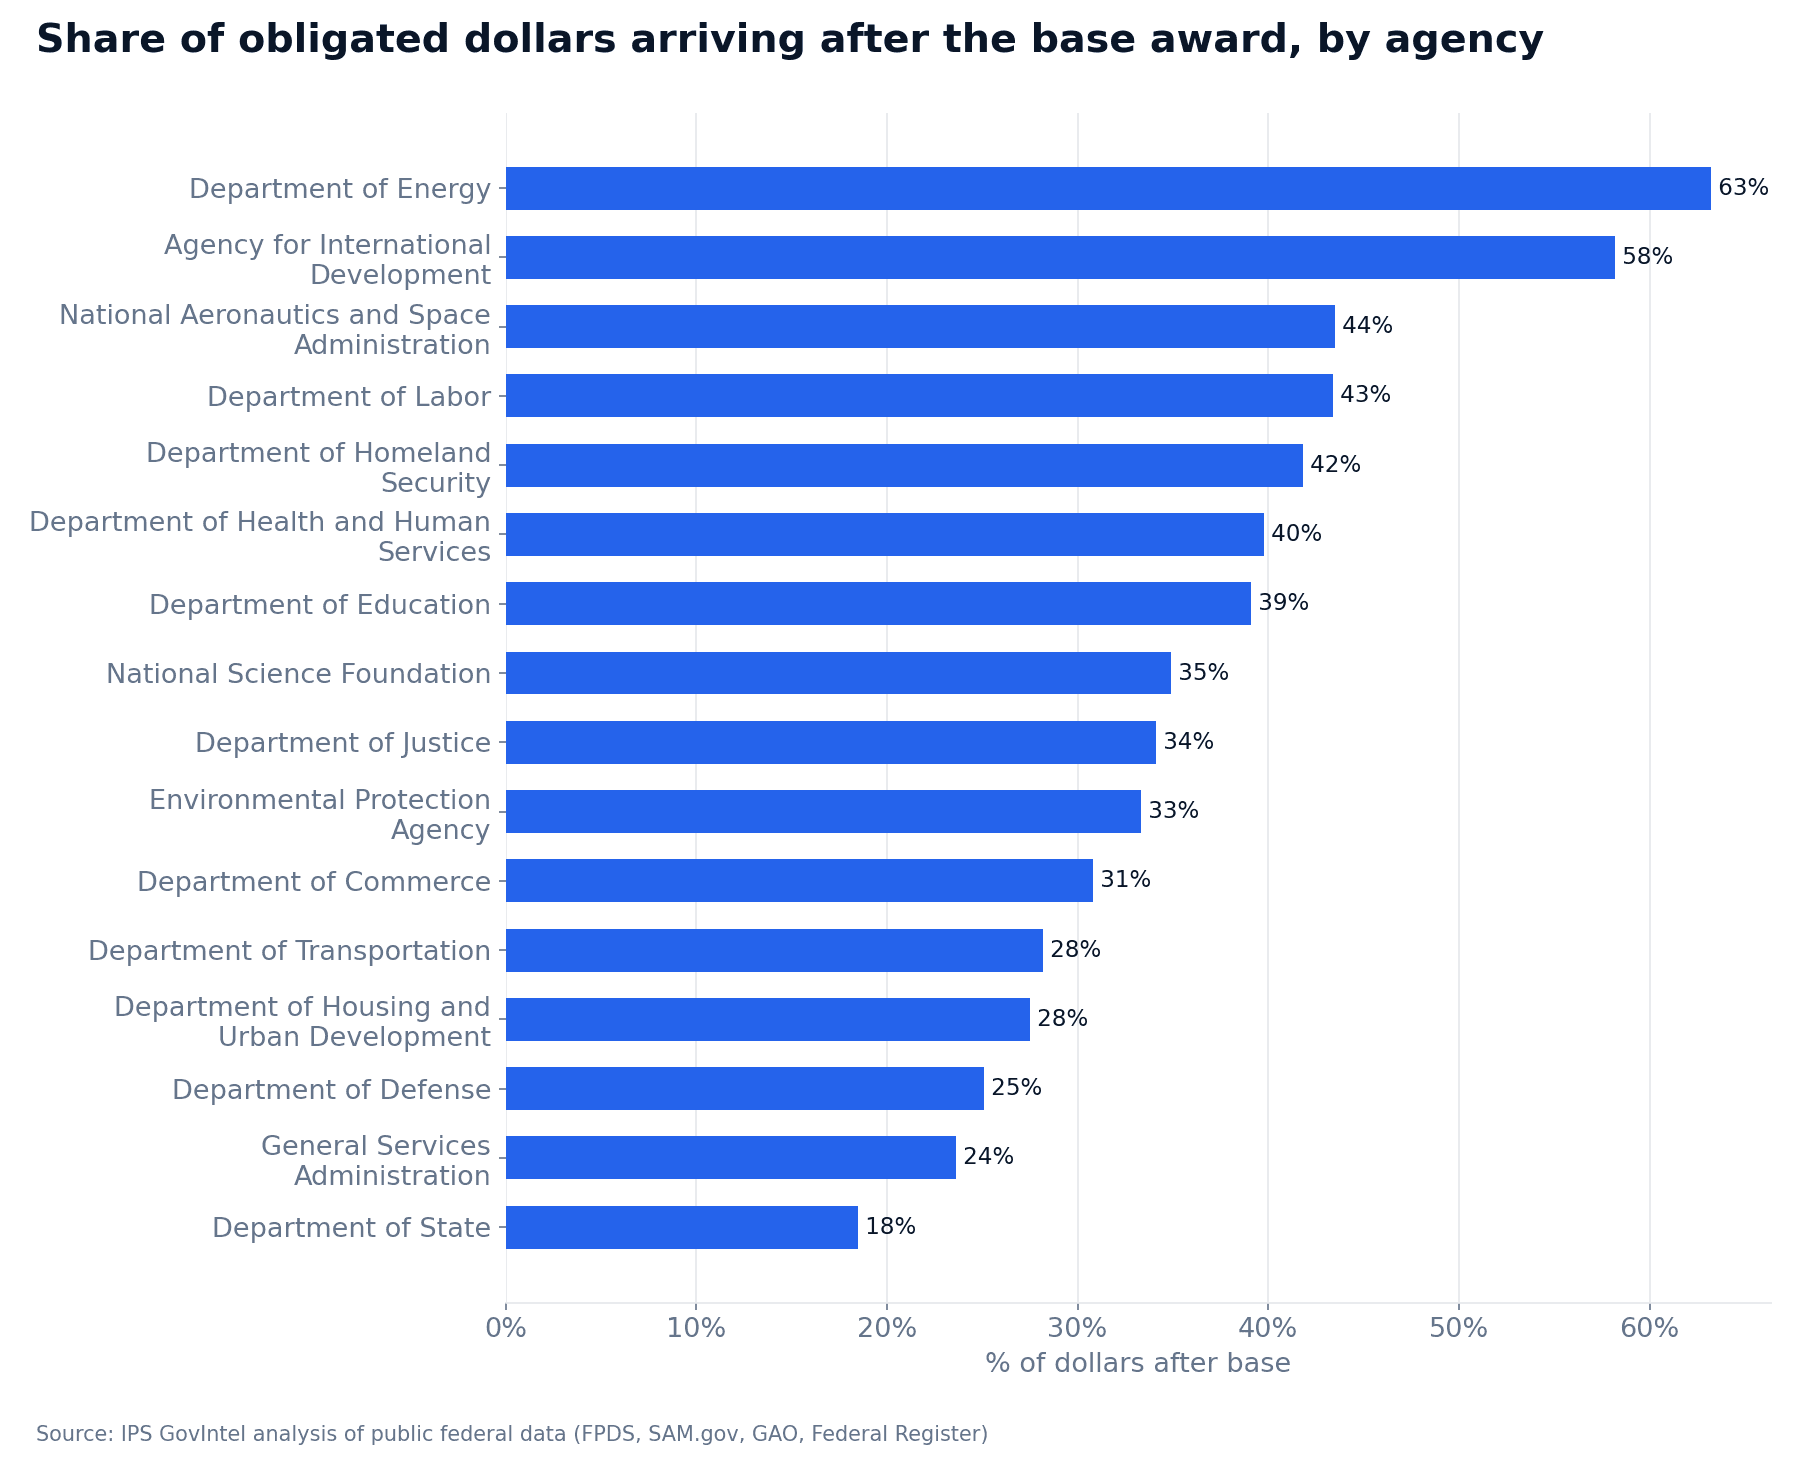
At the Department of Energy, 63.2% of obligated dollars on mature awards came after the base award. USAID was at 58.2%, NASA 43.5%, DHS 41.8% and HHS 39.8%. Among the 20 agencies in my cut, the low end was the VA at 3.5%, Agriculture at 7.5% and Interior at 9.7%. DoD sat in the middle at 25.1%. USAID was the only agency with a median growth above 1.0x (1.09x), and 30.9% of its awards doubled. DOE and USAID each have only a few thousand awards in the sample, so a handful of large awards can move those shares. GSA awards doubled only 3.8% of the time.
So "how much will this grow" depends heavily on who's buying.
What the Data Can't Tell You
I also tried to measure timing: how much growth arrives within 12 and 24 months. At the median, the answer is nothing. For both the FY2022 and FY2023 cohorts the median multiple is 1.0x at 12 months, at 24 months and at the latest data point. That's because most awards never grow. A timing curve for the awards that do grow would need a separate cut, so I'm not going to claim one.
This dataset also tracks obligations, not ceilings. It can't tell you how much of an IDIQ ceiling or the total value of priced options was actually used. And it shows what happened, not why. It won't distinguish an exercised option from a scope increase, a de-scope, or a contracting officer moving money between line items.
What to do with this
- Sort your backlog by option structure. Forecast awards with priced options above the base, and forecast awards without options at the base. Option exercises were the biggest separator in this data.
- Weight by contract type. On cost-type, T&M and labor-hour work, plan for incremental funding and more modifications. Doubling happened roughly 30% of the time or more, but it comes in pieces.
- Adjust for the buying agency. Expected growth on a VA award should be different from expected growth on a DOE or DHS award. Use agency-level history and don't apply one growth factor to everything.
- Check how far your capture models look back. Using FY2025–FY2026 awards as "typical" understates growth because those cohorts are still maturing.
- Get option exercises into the cash plan now. Q4 is option and year-end season. If your forecast assumes an option will be exercised, confirm the timing with the contracting officer before it slips.
The base award is where the contract starts, and for most awards it's also where it ends. Forecast each one accordingly.
Want this kind of read on your own pipeline or market? Get in touch.
Topics

Josh Parker
Founder of Indy-Pendent Solutions and flowState Software. Former Air Force combat rescue pilot, defense program manager, and capture strategist with 20+ years in defense acquisition.
Need help with your next capture?
Our software tools can help you win more government contracts.